.png)
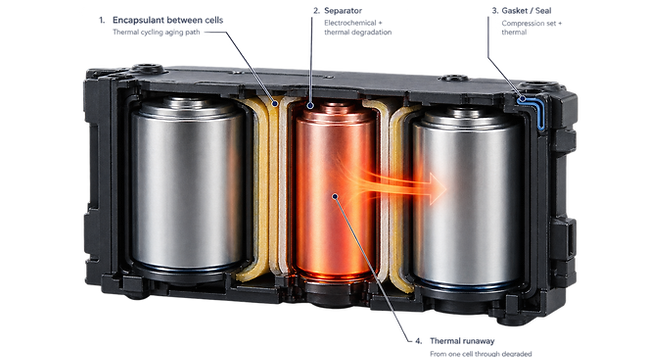
Thermal degradation is a major cause of polymer aging failure. ElastoSure K-Load models Diffusion-Limited Oxidation (DLO) by coupling oxygen diffusion, oxidation, and temperature. K-Flash handles fast thermal events, while K-Fail converts degradation into remaining service life.

Trusted by Industry, Government & Research Leaders


What Is Polymer Thermal Degradation?
Polymer thermal degradation follows oxidation chain reactions involving initiation, propagation, and termination. In the Arrhenius regime, reaction rate increases exponentially with temperature.
The DLO crossover temperature varies by polymer: NBR 90–110°C, EPDM 120–140°C, FEPM higher. ElastoSure K-Load uses a full coupled reaction-diffusion model, rather than the Arrhenius shortcut.
In thick parts, Diffusion-Limited Oxidation (DLO) creates an oxygen gradient from surface to core, causing rapid surface oxidation and slower core degradation. This produces a heterogeneous property distribution that surface tests cannot capture.
What You Get From ElastoSure for Polymer Thermal Degradation
Output
DLO oxidation gradient
What It Tells You
Oxygen concentration and oxidation state through the full thickness at any time
Decision Enabled
Explain why field parts fail faster than thin coupon tests predict -- and quantify the factor
Property profile (through thickness)
Tensile strength, hardness, elongation-at-break as a function of depth at any time
Design minimum wall thickness and surface protection to keep worst-zone properties within spec
Thermal degradation rate
map
How fast each zone of the part is degrading under its local oxygen and temperature conditions
Identify the controlling failure zone -- it is rarely where engineers assume
Arrhenius error factor
Quantified over-prediction of service life from standard Arrhenius extrapolation vs. DLO model
Justify why a higher safety factor or shorter maintenance interval is needed
Remaining Useful Life (RUL)
Service life accounting for DLO gradient and worst-zone degradation
Set inspection intervals and replacement schedules from physics, not from tables
Who Uses This

Oil & Gas
HPHT downhole seals (150–200°C) — DLO aging model & elastomer validation
Explore Oil & Gas
→

Nuclear
Cable insulation & rubber seals — DLO predicts end-of-life performance
Explore Nuclear
→

Aerospace
Engine bay elastomers, high-temperature gaskets & thermal protection polymers
Explore Aerospace
→
ElastoSure in Action
Case Study

CFRP Moisture Aging
Moisture absorption and Tg degradation prediction with coupon test validation.
View Case Study →

Wind Turbine Blade Aging
20-year prediction of fatigue damage and UV surface oxidation.
View Case Study →